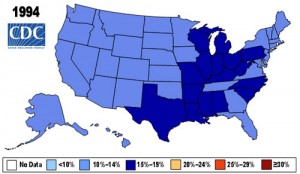
Society is getting bigger, but it’s not getting bigger uniformly. There are variations based on geography, occupation, race, income, religion, shoe size, you name it. Let’s start with the US[1].
Geography
The relative amounts seem to be similar. That is, the biggest states in 1994 are still the biggest ones (roughly), but they’re bigger now.
Race
Racial disparities exist, but seemingly only in women[2]. Obesity has increased from 15% to 30% in men of all races. White women had the same change, but for black women the change was 30% to 54%. It should be noted this does not control for wealth, which brings us to that can of worms…
Wealth
The relationship between wealth and obesity is complicated. In rich countries, there is evidence that being poor is a risk factor. Figure 3 from the review above shows that obesity was 26.7%/29.4%/23.6% for low/med/high SES men (not a typo, medium has the highest) and 37.8%/34.5%/29.9% for women (year 2000). Many articles just say something to the effect of “poor people are fatter” without much thought. There is certainly literature supporting that notion [3]. The basic mechanism is that calorie dense food is cheaper per calorie, and people tend to eat more calories overall when their food is more calorie dense [citation needed]. This is not true in all countries.
Depending on how you slice the data, it can look a bit different. Everybody uses NHANES data, and most studies divide people into income quintiles. One paper just divided people into “poor” and “not poor” [4] and found that while the prevalence of obesity among the two groups was the same, the poor had higher average BMI. Meaning that a poor obese person was generally much fatter than a rich obese person.
On a global scale, the relationship is different. A quick gander at Gapminder World shows that wealthier countries are heavier. This should not be a big surprise; only where food is relatively cheap can people consume lots of it. This trend holds true in the US as well [5]:
Along the same lines, the real fast-food restaurant price, the real food at home price and the real full- service restaurant price have negative and significant effects [on BMI] at weighted sample means.
Coming next week (probably): A comparison of different countries as they stand today. Working title: Why is Japan so thin and the US so fat?
-Jacob
- [1]http://www.cdc.gov/obesity/data/adult.html↩
- [2]Epidemiol Rev (2007) 29 (1): 6-28.doi: 10.1093/epirev/mxm007 http://epirev.oxfordjournals.org/content/29/1/6.full ↩
- [3] Poverty and obesity: the role of energy density and energy costs
Am J Clin Nutr January 2004vol. 79 no. 1 6-16
- [4]Overweight and poor? On the relationship between income and the body mass index
Volume 9, Issue 4, December 2011, Pages 342–355
http://www.sciencedirect.com/science/article/pii/S1570677X11000827↩
- [5]An Economic Analysis of Adult Obesity: Results from the Behavioral Risk Factor Surveillance System
Shin-Yi Chou, Michael Grossman, Henry Saffer
NBER Working Paper No. 9247


